Supermicro Shares Surge Following Nasdaq Compliance: What Investors Need to Know
Supermicro (NASDAQ: SMCI) is making headlines this week as its shares bounced back by an impressive 12% after the company submitted its long-awaited financial reports just ahead of a critical deadline. This timely filing helped the firm avoid potential delisting from the Nasdaq, alleviating concerns among investors who had speculated about its compliance with exchange regulations.
Market Reaction and Technical Analysis
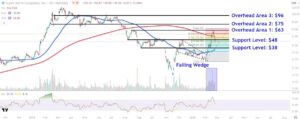
This spike in share price comes after a streak of four consecutive days of losses, during which Supermicro found support near the 50% Fibonacci retracement level—a crucial technical indicator for traders. This support base provided the momentum for the stock to swing higher, allowing it to close at around $51.
What’s Behind the Recent Volatility?
Over the past year, Supermicro has struggled with declines, losing over 40% of its market value amid allegations of accounting irregularities and corporate governance issues. However, there is a silver lining: the stock has skyrocketed 68% since the beginning of this year. This turnaround aligns with a recent business update that indicated a positive revenue outlook, largely fueled by increasing demand for AI infrastructure products.
Furthermore, the Nasdaq has confirmed that Supermicro is now compliant with its filing requirements, effectively closing the chapter on this compliance issue. This clarity is essential for restoring investor confidence and may provide a foundation for future growth.
Key Levels to Watch
As always, savvy investors will want to monitor specific price points when trading Supermicro to make informed decisions. Here are some critical levels:
-
Resistance Levels:
- $63: The first area of interest is around the $63 mark, which has historically acted as a resistance zone due to its association with August’s countertrend peak.
- $75: A decisive close above $63 could pave the way for the stock to target the $75 level, which aligns with a trendline connecting lower lows formed between February and June.
- $96: If the stock pushes further upward, the $96 level is noteworthy, as this has been a historical resistance area, reflecting multiple peaks from February through July.
- Support Levels:
- $48: Watch the $48 area, slightly above the 50% Fibonacci retracement. This level has previously captured buying interest and could serve as a safety net for the stock.
- $38: In the event of a more significant pullback, the $38 level, supported by the September swing low and other key price points, may offer attractive entry opportunities for investors looking for long-term positions.
Final Thoughts
Supermicro’s recent performance and the surrounding volatility underscore the importance of both technical analysis and keeping an eye on corporate governance issues. While the stock has rebounded significantly this year, investors should remain vigilant of the key price levels outlined above and consider both the potential rewards and the risks of investing in a company still undergoing turbulence.
As always, we recommend a thorough analysis when considering any stock investment, and keeping up-to-date with your portfolio will provide valuable insights into market movements. Stay tuned with Extreme Investor Network for more in-depth analysis and market insights that can help you navigate the complexities of investing.

